
Decoding Social Media Metrics (FREE Scorecard Included)

Social media marketing can be a bit of a black box.
Whether you’re a small business owner, a seasoned marketer, or even a social media manager, there are so many changing elements that it can be challenging to keep track of what’s changing, what’s working, and why it all matters.
Amidst all of your other professional work, it can feel overwhelming.
Couple this with the fact that organic reach on social media is dying and more companies are relying on paid promotion. It’s clear that anyone using social media to reach their audience needs to measure their efforts, optimize their messaging, and try to get the very most out of the time and money they’re spending.
In order to do that, you need to start by defining which metrics matter most and build your plan accordingly. You need to understand what you’re measuring, how to measure it, and what the numbers are telling you.
You need a social media scorecard – and a good one!
Download: Social Media Scorecard Template

Your social media marketing scorecard enumerates the value of your efforts and can be one of the most important tools in your toolbox. It gives you a structured way to keep track of your efforts, prioritize your work, and be strategic about how you grow your business.
In this guide, we’ll offer a tactical strategy and approach to creating a killer scorecard, what it needs to measure and show some examples of how to set it up.
Social media metrics, terms, and definitions
Let’s start with a quick primer.
If you’re a seasoned marketer, feel free to skip ahead. But if you’re just learning the ropes, this will be a helpful resource for the basic terminology used to measure social media marketing.
Here’s a list of some terms that you’ll probably run into as you’re managing and measuring your social media marketing:
Attribution
How you assign the value of conversions that are generated from your marketing efforts. For instance, if someone clicks on a link from Facebook and then signs up on your website, you would attribute that conversion to Facebook. (Some sophisticated marketers look at multi-touch attribution for conversions that may require more than one interaction).
Channel
Marketing channels are the different ways that you reach your audience. Facebook, Twitter, email, and Google would all be separate channels.
Conversion/Conversion Rate
Conversions are the action(s) that you want a person to take. It may be signing up for an email list, completing a purchase, or scheduling an appointment. When looking at your website, you can measure your conversion rate by dividing the number of conversions that take place by the total number of visitors to your website within a given time period.
Say, for instance, that in January:
- 100 people visited your site
- Of those 100 people, 2 people booked an appointment
This means you had 2 conversions and a conversion rate of 2% (2/100).
CPA (Cost Per Acquisition)
When measuring the effectiveness of advertising, you can calculate, on average, how much you’ll need to spend in order to acquire a new customer or a single conversion.
To calculate this:
- Start with the total amount spent on advertising over a given period ($200)
- Divide that amount by the number of conversions that you can attribute to that advertising spend (3).
Based on these figures, you would have a CPA of $66.67.
This means that for every $66.67 you spend on advertising through that channel, you can expect to gain one new customer. You can then add this to your cost of doing business and compare with your price to decide if this is a smart investment that will help grow your business.
CPC (Cost Per Click)
When measuring the effectiveness of your online advertising, this figure will tell you how much you must spend in order to generate one click.
Most advertising has (or should have) a call to action like a link to your homepage or an article.
The lower the cost per click, the more traffic or clicks that you’ll generate for the same amount of money. On most advertising platforms, you can also set your “bid” on a CPC basis, meaning that you tell the site the maximum amount that you’re willing to spend on each click.
CPM (Cost Per Mille or Cost Per Thousand)
This is another term that relates to advertising. The CPM of a campaign is the cost that you are paying to generate 1,000 impressions on your ad or promotion.
For example, if you spent $40 on a campaign and generated 2,100 impressions, then your CPM would be about $19. If you wanted your ad to be shown another 1,000 times, you’d need to spend about $19 more.
CTR (Click-Through Rate)
How likely are people to click on your ad or post on social media? That’s measured by your CTR. Whether this is an organic post or a paid promotion, your CTR is calculated as follows:
- Total number of clicks over a given period (25)
- Divided by total impressions over that period (1,500)
In this example, you would have a click-through rate of 1.67%.
You can also use this click-through rate to calculate that for every 100 impressions, you are likely to generate 1-2 additional clicks.
Pro tip: Use a custom URL shortener like Rebrandly to brand the links you create and share on social media. Using branded links can increase your click-through rate by up to 39%.
Engagement/Engagement rate
Engagement is a broad term that can mean a lot of different things.
But, in the world of social media marketing, engagement is generally measured as some kind of interaction with a post or an ad. For example, likes, shares, and comments may all be considered a form of engagement.
If you send out a tweet that gets 3 likes and 1 retweet, then you had 4 total engagements.
You can also calculate this as an engagement rate by dividing your number of engagements by the number of impressions.
If your tweet received 4 total engagements and had 350 impressions, then your engagement rate is (4/350) = 1.1%.
Reach/Impressions
Reach or impressions are the most basic ways of measuring the performance of your social media marketing. It’s the answer to a simple question: How many people are seeing what I say?
Usually, Reach is the measurement of the unique number of people who came into contact with your post (saw it on their feed, etc.). Impressions, on the other hand, are how many times your message was shown to people in aggregate. So, if 100 people saw your Facebook post, 2 times each, then you generated 200 impressions and a reach of 100.
Many people consider reach and impressions to be a “vanity metric” that doesn’t prove any real business value.
But, keep in mind that reach and impressions can still be valuable for building brand awareness and could lead to more important conversions later on.
ROAS (Return On Ad Spend)
Get down to the brass tacks on your advertising efforts with ROAS.
This is a bottom-line metrics: For every $1 you spend on ads, how much do you generate in revenue?
The formula is simple: Revenue from Ads / Cost of Ads = ROAS (as a percentage of spend)
The key here is that you need to know how much new revenue was generated by the ads that you ran.
But, depending on the type of business you have, this can be a bit tricky to calculate. If you run an e-commerce company, for instance, then the best thing you can do is track your total purchase value (attributed to ads) versus the amount spent on ads. But, for some companies, the value for each new conversion or customer may not be clear.
If it’s not 100% clear, then you may consider calculating an average customer value, sometimes known as the CLV (customer lifetime value). This is just the average value of a new customer or client. Then, you can calculate your ROAS with new steps:
- Add up all of the new customers attributed to your ad campaign (8)
- Multiply that number by your CLV ($3,000) to calculate return
- Divide by the cost of the ads ($5,000)
With these numbers, you can calculate a ROAS of 4.8 or 480%.
This means that for every $1 you spend on ads for this campaign, you expect to earn almost $5 in new revenue.
ROI (Return On Investment)
The more-generic cousin of ROAS is Return On Investment (ROI).
This is a standard measure of how much you get out versus how much you put in.
Calculate it simply: Return / Investment = ROI
So, if you invest $20,000 in a new website and it helps you generate $50,000 in new business, then the ROI of that investment is 2.5 or 250%.
How do I report Social Media Metrics?
Now that we’ve tackled all of the lingo and jargon, it’s time to think about how we can build a scorecard that will help us measure all of the stuff that’s happening in the social media universe.
For your social media scorecard, your goal should be to measure two main types of data:
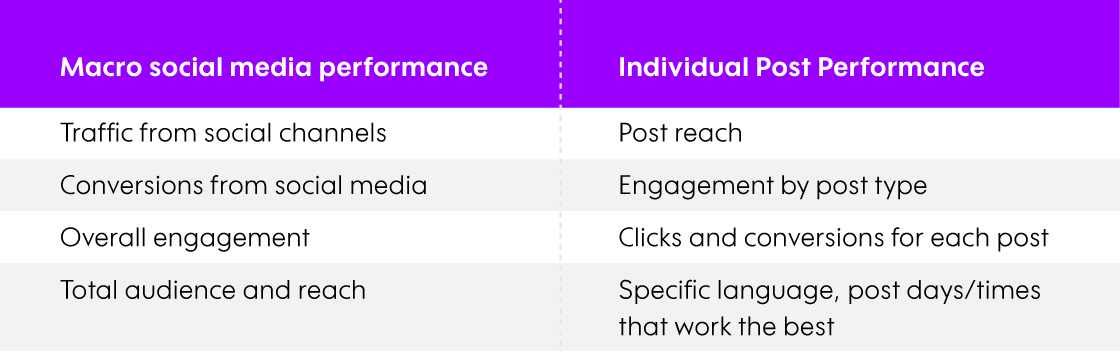
Looking at the macro-social media performance metrics over time (e.g., traffic from social media) will help you see if your efforts are driving growth over time. These two data sets will serve to both give you a high-level look at the performance of your marketing efforts and also give you granular data on your tactical execution—what’s working and what’s not.
Meanwhile, you can glean more specific insights about the types and formats of content that are most effective, which channels lead to the best results, and more by keeping track of individual posts, tweets, or shares.
On their own, these metrics only tell part of the story about your social media marketing efforts. But, together, they give a clear picture of both high-level KPIs and detailed performance.
Defining your social media KPIs
Now that we’ve broken down our social media measurement efforts into two big buckets, we also want to think more specifically about the types of numbers that we’ll measure to evaluate our performance.
These are your key performance indicators–KPIs.
They are the numbers that we use to evaluate the overall performance of the social media marketing efforts and also provide insight that we can use to improve our strategy.
When thinking about social media KPIs, it may be helpful to break them into 3 main categories:
- Reach / Audience
- Engagement
- Conversions
Again, we find that it’s most helpful to measure social media efforts from a few different angles in order to get a full picture of its effect on the business.
Logan Young at Blitzmetrics illustrated the point by talking about the inverted funnel they use when thinking about their social media marketing strategy for clients.
Here’s what it looks like: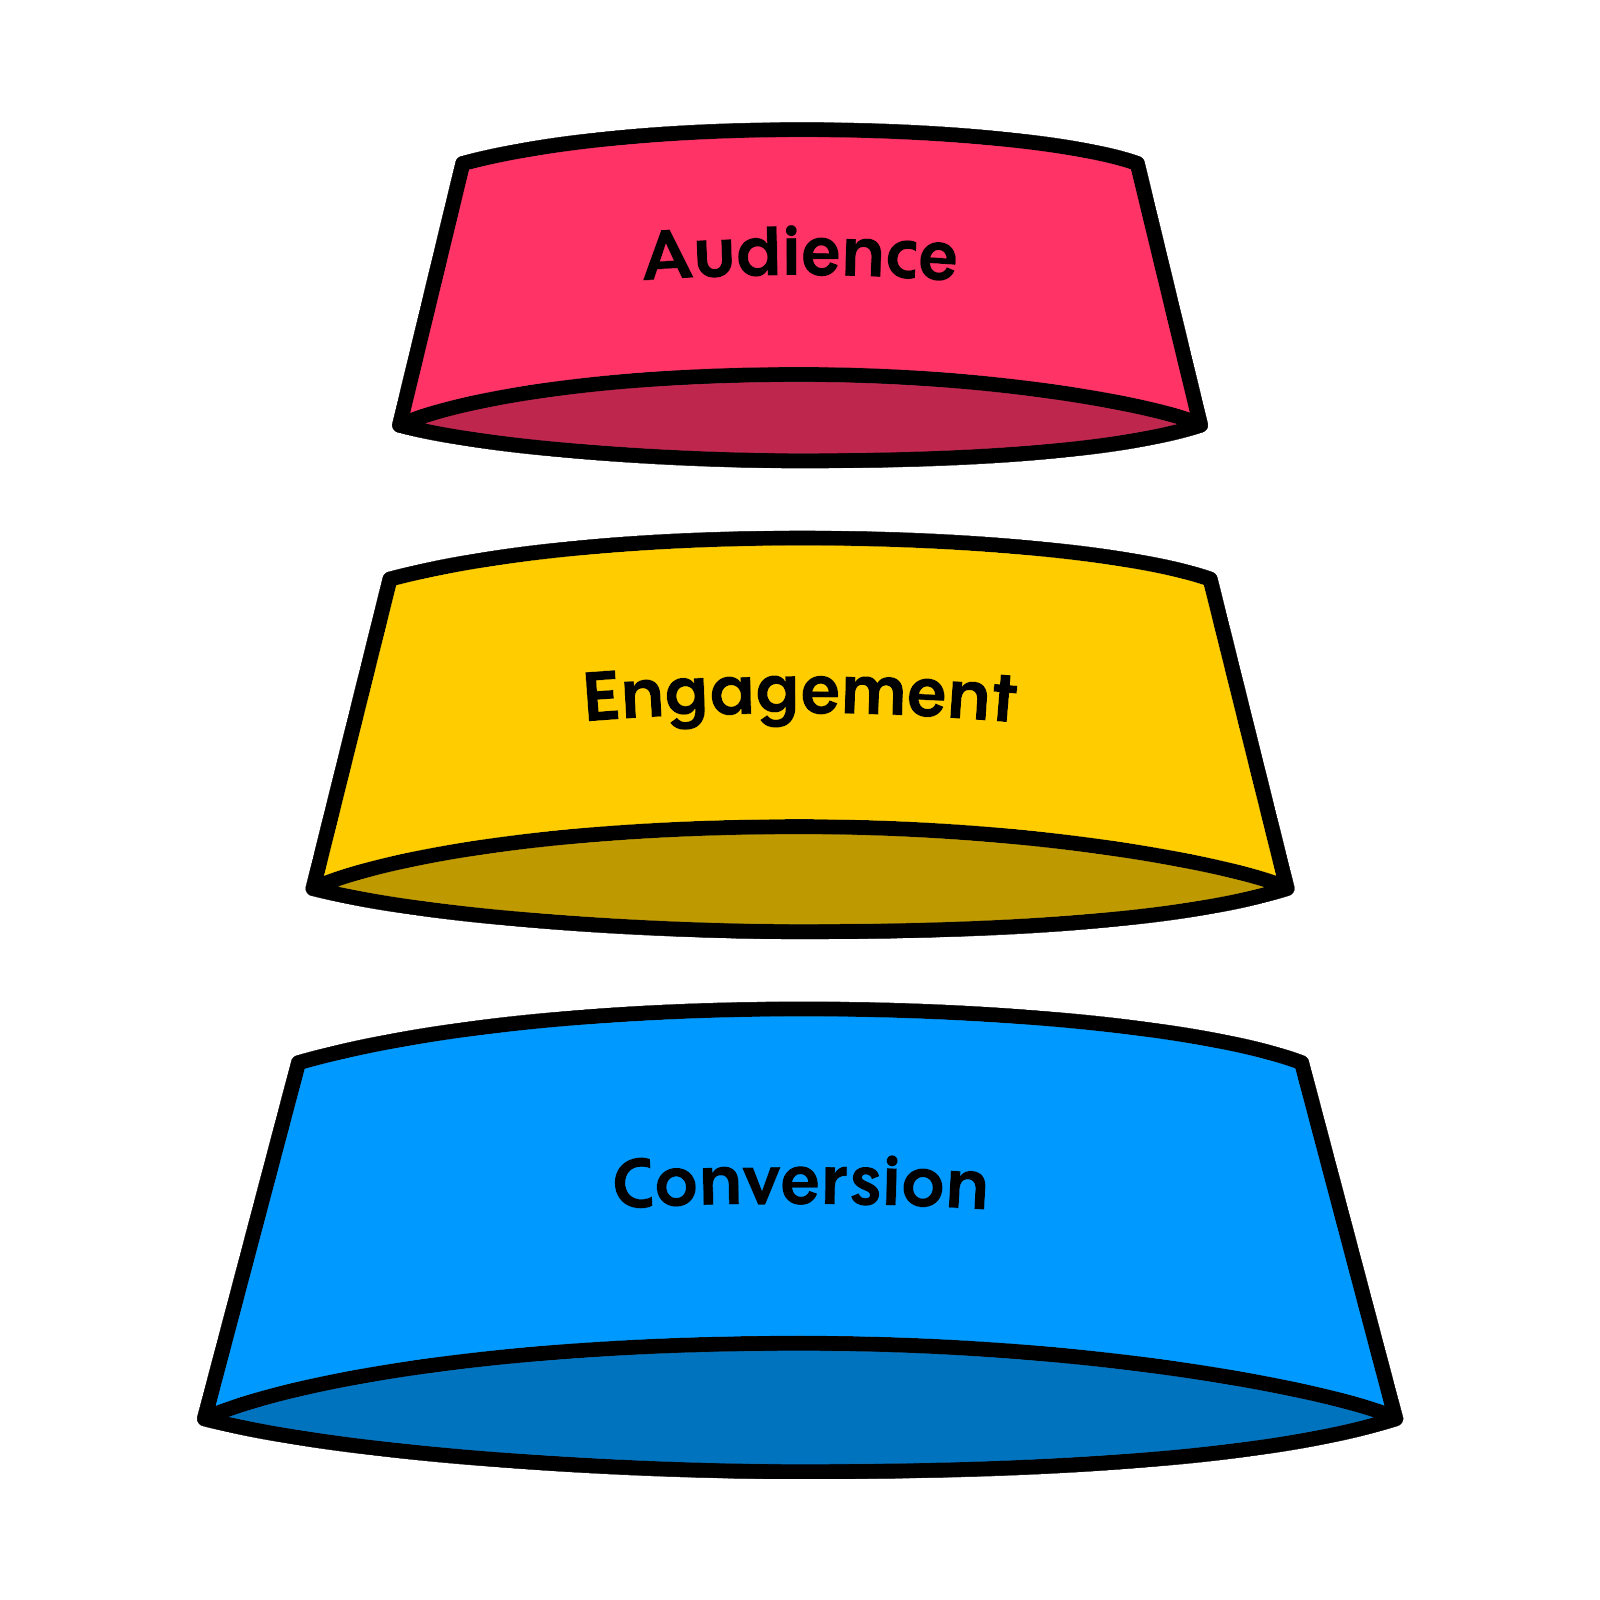
First, we have top-line metrics on social media reach, such as views, fans, or followers. While these may seem like “vanity” metrics that don’t correlate with real business objectives, they are a valuable measure for some marketing goals. If your marketing strategy is primarily aimed at increasing brand awareness or brand positioning, then these metrics offer a good way to measure your results.
If you go one step further, you can measure the level of engagement that you’re generating on social media. These numbers–likes, retweets, shares, etc–are still a step removed from the final business objective. But they can still be a leading indicator that your audience is engaging with your brand, your content, or your offers. Improving your engagement will likely correlate with more traffic or conversions.
Lastly, we have the bottom of the funnel–conversions driven by social media marketing.
To define your KPIs, take these 3 steps:
- Identify your ultimate goal (Sales, brand awareness, email sign-ups, etc.)
Start by thinking about why you’re investing in social media marketing to begin with. What are you actually hoping to accomplish?
- Choose a primary metric that will measure this performance (Reach, traffic, conversions, etc.)
Based on your ultimate goal, you’ll need a way to measure your performance. In some cases, this may be straightforward. For instance, if your goal is more sales then one key metric is the number of sales that are directly attributed to your social media marketing.
- Consider secondary metrics that may help capture the full picture
Your social media metrics may not be a 1:1 fit with your goals. You can measure performance and progress by using a few different indicators.
Using the above example, you may be able to attribute some of your sales directly to social media. But other customers may see you on social media and then visit your site directly or come from Google. To help capture this effect, you can measure overall sales over time to see if they grow as your social media presence increases.
You can also get creative and use special coupon codes or referral links to help track activity from social media as a whole or even specific channels like Facebook or Instagram.
It’s also a good idea to use custom tracking codes (also called “UTM” codes) that feed data into Google Analytics. These are an important tool for all marketers. Google has a guide on using these parameters and even offers a free tool that will generate custom tracking URLs.
With the right measurements in place, this can be easy to measure effectively.
If you’re a more advanced marketer, you can use more sophisticated analysis to capture conversions driven by social that may have happened over a long attribution window. In this case, social media may have only assisted in the ultimate conversion, but it still played an important role in the customer journey.
You can use the Google Analytics multi-touch attribution report to get a look at how social media is assisting your website’s conversions:

This report shows you how many visitors who covered on your website visited your site from social media within the last 90-day window. This is a powerful tool for getting a full picture of how social media is driving business beyond just traffic and clicks.
For more on this, read the official guide to using the multi-touch attribution tool in Google Analytics.
Measuring social media reach
One of the most basic goals of any social media marketing strategy is reach and brand awareness. Not every post, tweet, and share can drive a sale or conversion. But they can help you reach new potential customers.
While these numbers may not go directly to the bottom line, it’s worth building a social media scorecard that measures your social media reach.
Is your social influence growing?
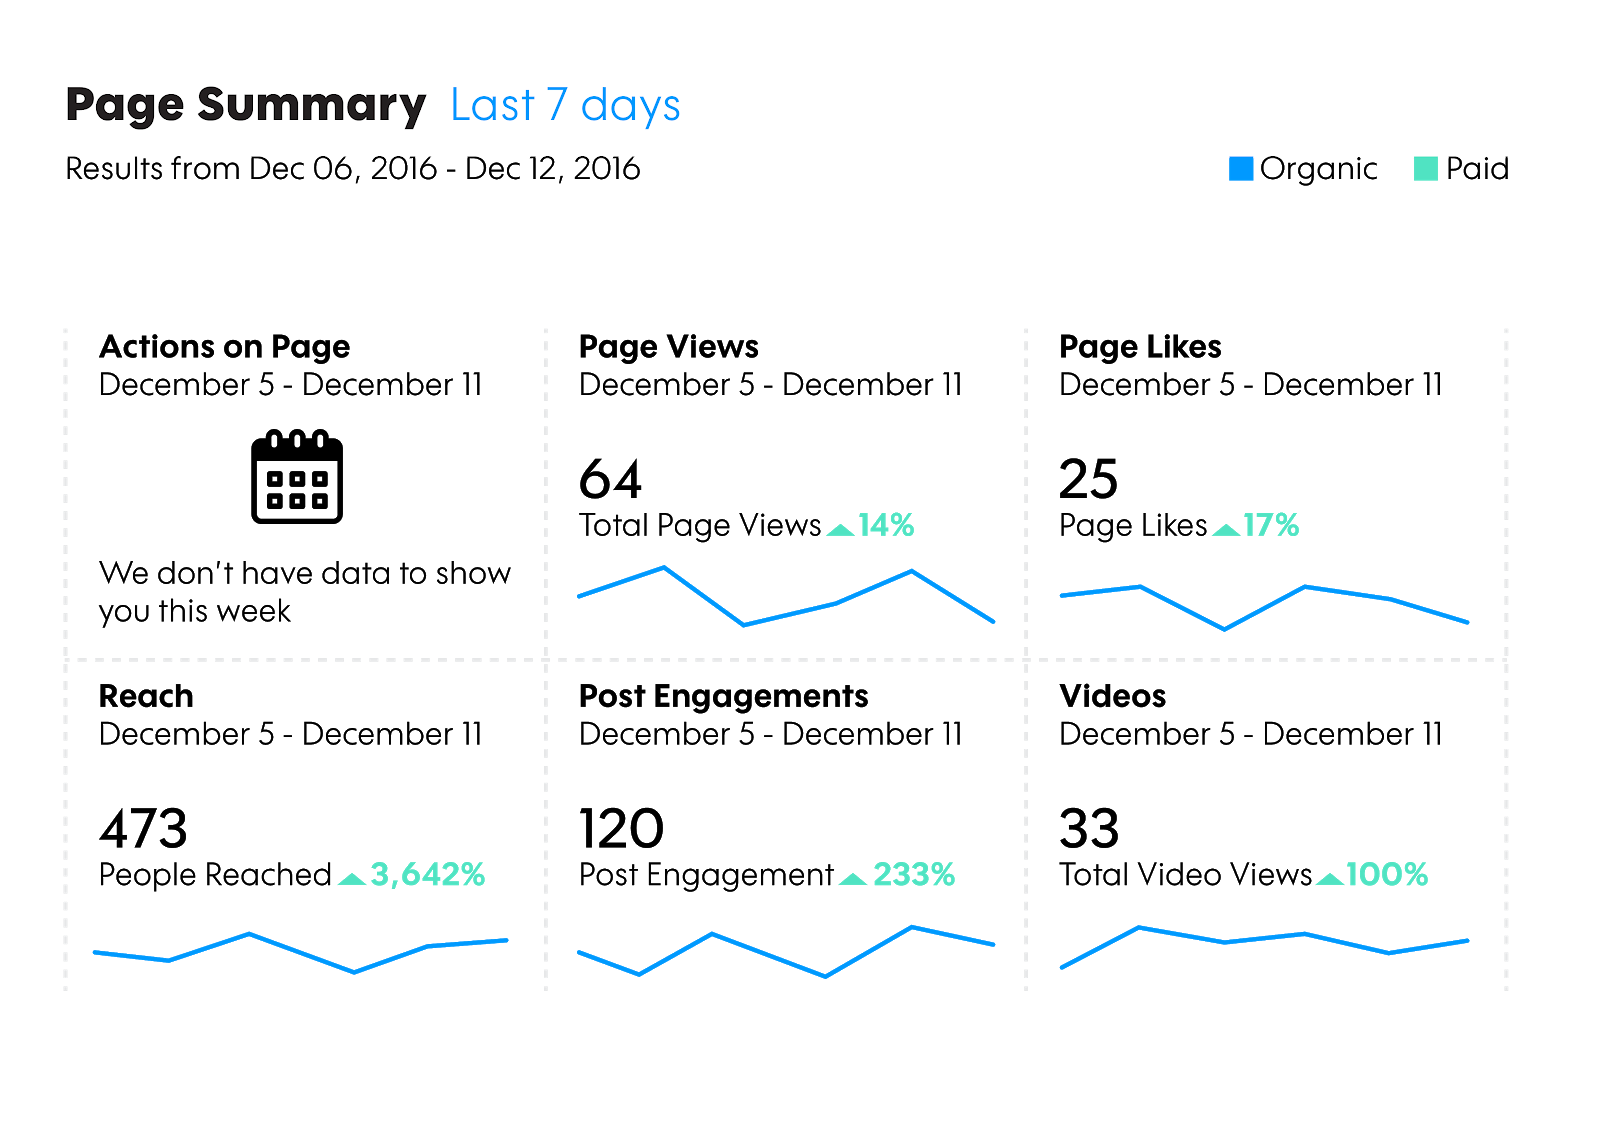
Start by looking at high-level metrics over a given period. On Facebook, for example, you can see your social media reach for the week or month. This will give you a strong baseline for how many people your social media is reaching and if that number is changing or growing.
 Don’t stop at the macro trends on social reach.
Dig into each individual post and keep a running tally of which posts are getting the most and least reach. With changing algorithms on nearly every social channel, the type of content that gets the most reach can help point you toward content ideas that will take advantage of shifting social feeds.
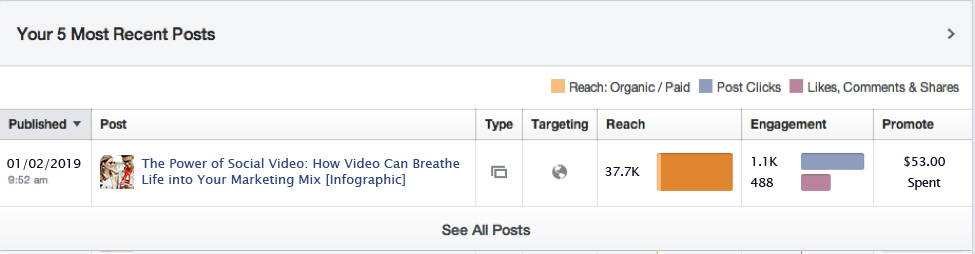
While each platform generally has some decent metrics built in, it’s helpful to aggregate this data into your own internal scorecard. Not only does this make it easier to share with your team, but it gives you more control and insight from the numbers. You can better analyze the metrics that matter most, rather than just what’s shown in the native interface.
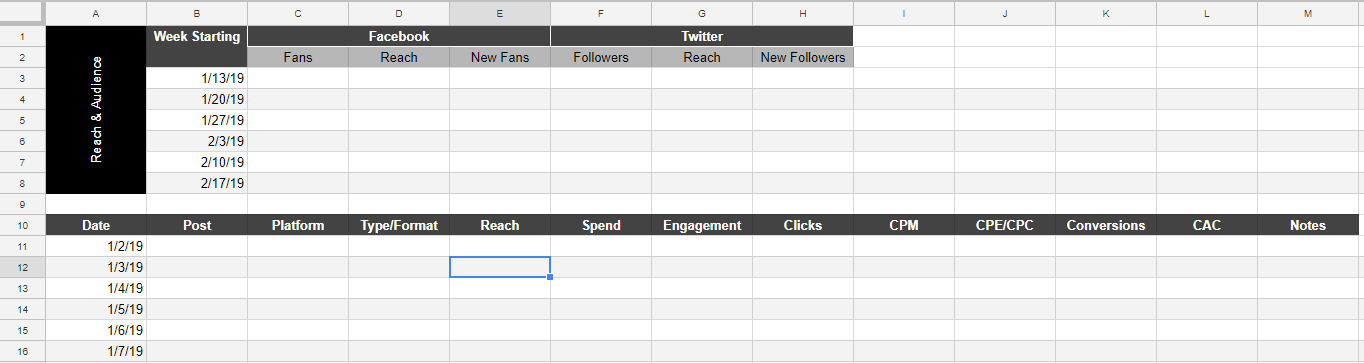
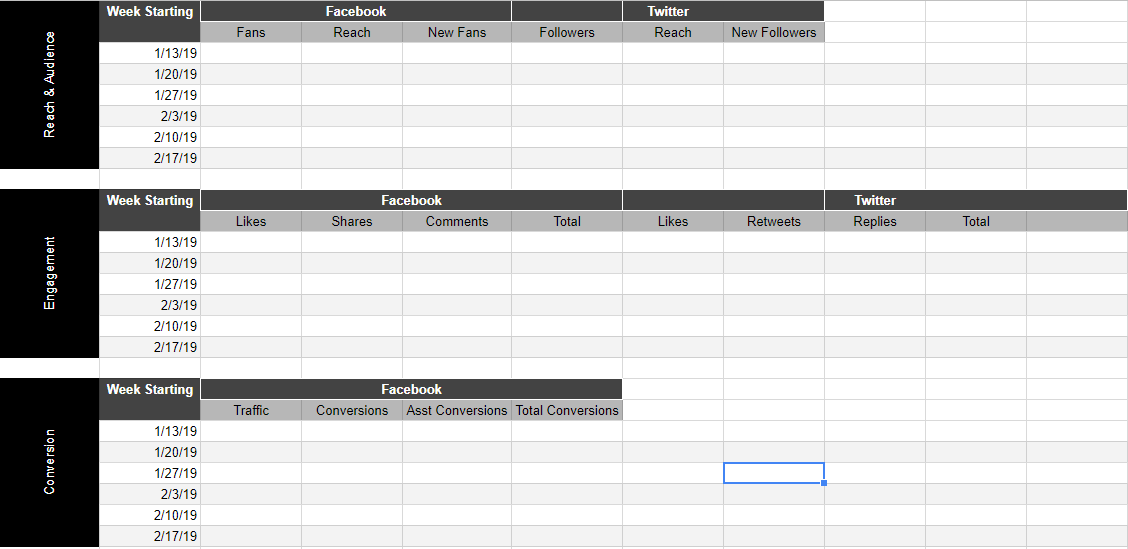
If you’re rolling your own scorecard in-house, you might create something simple like this to track both sets of metrics for overall reach and audience.
Measuring social media engagement
Next down the funnel is social media engagement.
Your scorecard should keep track of how your social media posts and activity are generating engagement from your audience.
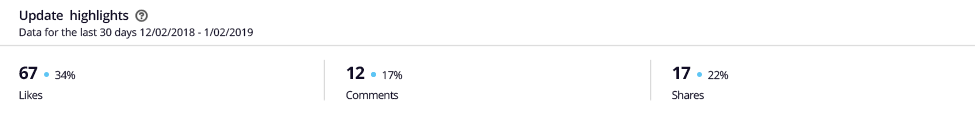
Again, we want to start with measuring macro engagement on your social accounts. How many likes, shares or retweets are your posts getting in aggregate?
As your audience grows and your reach increases, you should watch for your engagement to also tick up. If your visibility is climbing but engagement rates are declining, then you may be reaching a fake or less-engaged audience. You may want to adjust your strategy to focus on your core audience more closely.
Taking this a step further, you can look at your engagement on particular posts to get an even clearer picture of what resonates most with your audience.

Are videos getting more likes than photos? (Hint: Yes, they probably are.)
Do emotional, personal anecdotes get shared more frequently than data-driven facts? Yes.
(Or, let’s face it, those hilarious memes are probably what’s driving all of that engagement!)
Analyzing which individual posts are getting the most engagement can also help you fine-tune for social media marketing strategy, identifying what content resonates with your audience so you can post more of what works.
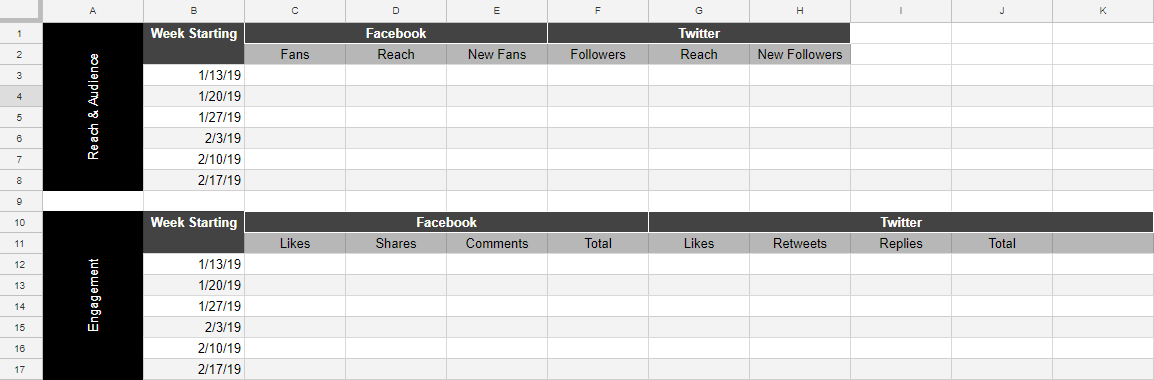
Let’s expand our scorecard example from above to now include macro trends data on the engagement we’re seeing from different channels.
Now we have a good scorecard that’s coming along. But we’re not done yet—we want to measure the final piece of the funnel, conversions.
Measuring social media conversions
Last, but certainly not least, we need to get to where the rubber meets the road. Is all of this social media marketing, visibility, and clicks actually adding up to real business value?
Most likely, yes, if you know how to measure it.
Start first by tracking how well your social efforts are driving traffic. Most likely, one of your goals is to move your audience on Facebook, Twitter, etc and get them onto your company website.
With Google Analytics, this should be simple to measure:
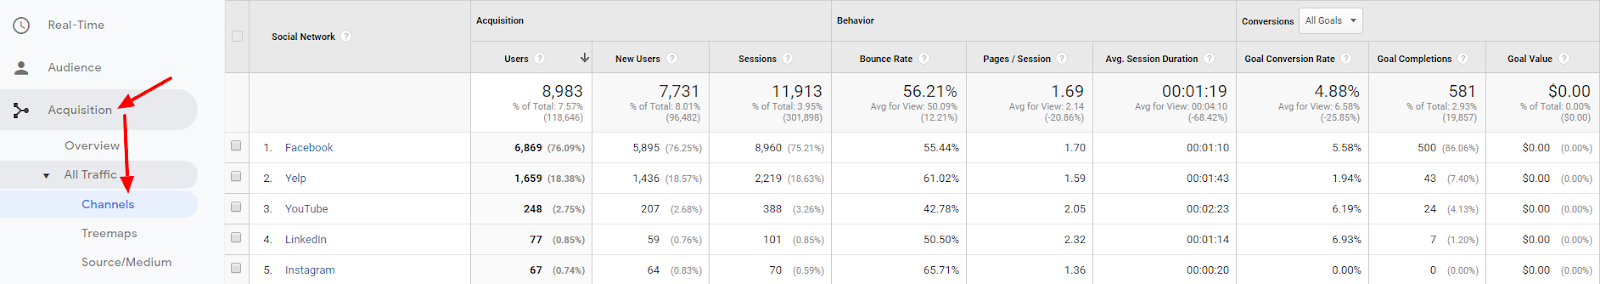
Assuming that you’re able to track conversions from individual posts based on the scorecard section we created above, let’s focus on the macro trends.
It may take a bit of extra work to figure out how to track the aggregate influence of social on your business objectives. If you’re able to convert people directly through social media channels, then you may be able to simply tally up those sales or leads directly. But, most companies will want to measure both the amount of traffic they are able to drive from their social media page or profile and the conversions that result from that traffic as it flows in.
Calculating your social marketing effects on conversions can be a bit more nuanced than some of the other data we showed here.
There are multiple ways to attribute and assign value to different interactions along the buyer’s journey. For our purposes, let’s just get the raw number of conversions where social was part of the equation.
As we discussed above, Google Analytics has a pretty helpful tool that will allow you to measure assisted conversions from social channels.
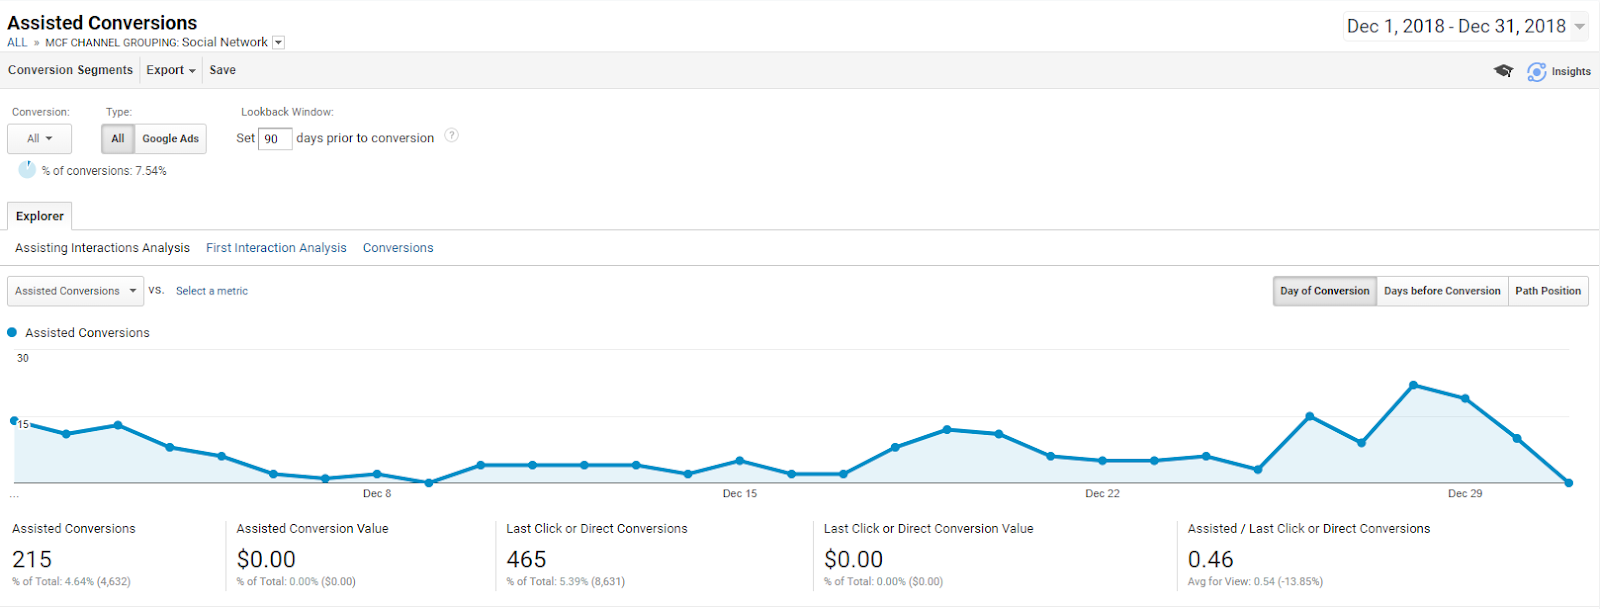
So, if we break down the report, we can see the following data:
- 465 “direct” or “last-click” conversions came from social channels in the last month (meaning the user clicked into the site from a social media source and then completed a conversion during that same session)
- 215 more conversions during the month were assisted by a visit from social media within the prior 90 days
In other words, social media was involved in a total of 680 conversions in the last week–about 32% of those were assisted and wouldn’t be captured if only measuring direct conversions.
So we can add our traffic and conversion metrics to the scorecard to round out a final tally of the investment in social media marketing.
Now you should have a full data set that shows the effect of your social media efforts all the way from awareness and visibility through to actual conversion and revenue.
As a marketer, it’s important to understand the data and understand how your efforts are actually moving the needle for the business.
Turning your social media data into a dashboard
Once you have a baseline scorecard that captures and tracks all of your data, you can turn it into a simple dashboard that gives you a snapshot of your social marketing efforts.
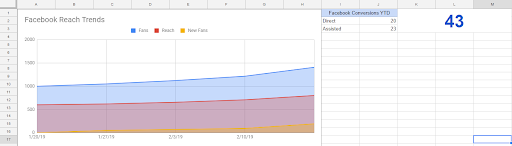
This is really just a matter of taking the data and turning it into a chart.
For those less-fluent in Excel or Google Sheets, you can create these charts pretty easily.
Just click on the sheet where you want to create your chart. Then, go to Insert > Chart, and select the data that you want to transform into a nice visual. You can tweak the design to your heart’s content, but generally, it’s pretty good at guessing the right type of chart to display your data properly.
Think carefully about which metrics you want to visualize here. Remember that your dashboard is not meant to be a deep-dive on all of your data. It’s just meant to give you (or your boss) a quick snapshot of your progress.
Boil down your full set of KPIs into the metrics that provide a good sense of the overall efforts and the generated outcome.
Benchmark your social media marketing
Measuring your own social media metrics can be helpful for telling you if your efforts are getting better or worse over time.
But, you may also be wondering how you’re performing compared to others, either within your industry or across social media at large. This kind of benchmarking is an important step in the process and gives you some context for setting internal goals on your own social media performance.
If your efforts are outperforming industry standards, then maybe your goals for improving that number shouldn’t be more aggressive than if you’re lagging behind your peers. Either way, you need context to understand your company’s performance.
Let’s look at some of the current benchmark data that’s available to give you a general sense of what might be reasonable when setting your own goals, expectations, or forecasts.
Social media reach benchmarks
The first stop on our journey is reach.
Reach is a very subjective measurement. How many people you reach will depend largely on the size of your existing audience–how many fans or followers you have–and how frequently you post. If you’re spending money to boost or promote content, that can also dramatically increase your reach.
But, what we have seen consistently over the last few years is that organic reach as a percentage of your overall audience has been steadily decreasing, especially on Facebook.
Here’s what the data shows:
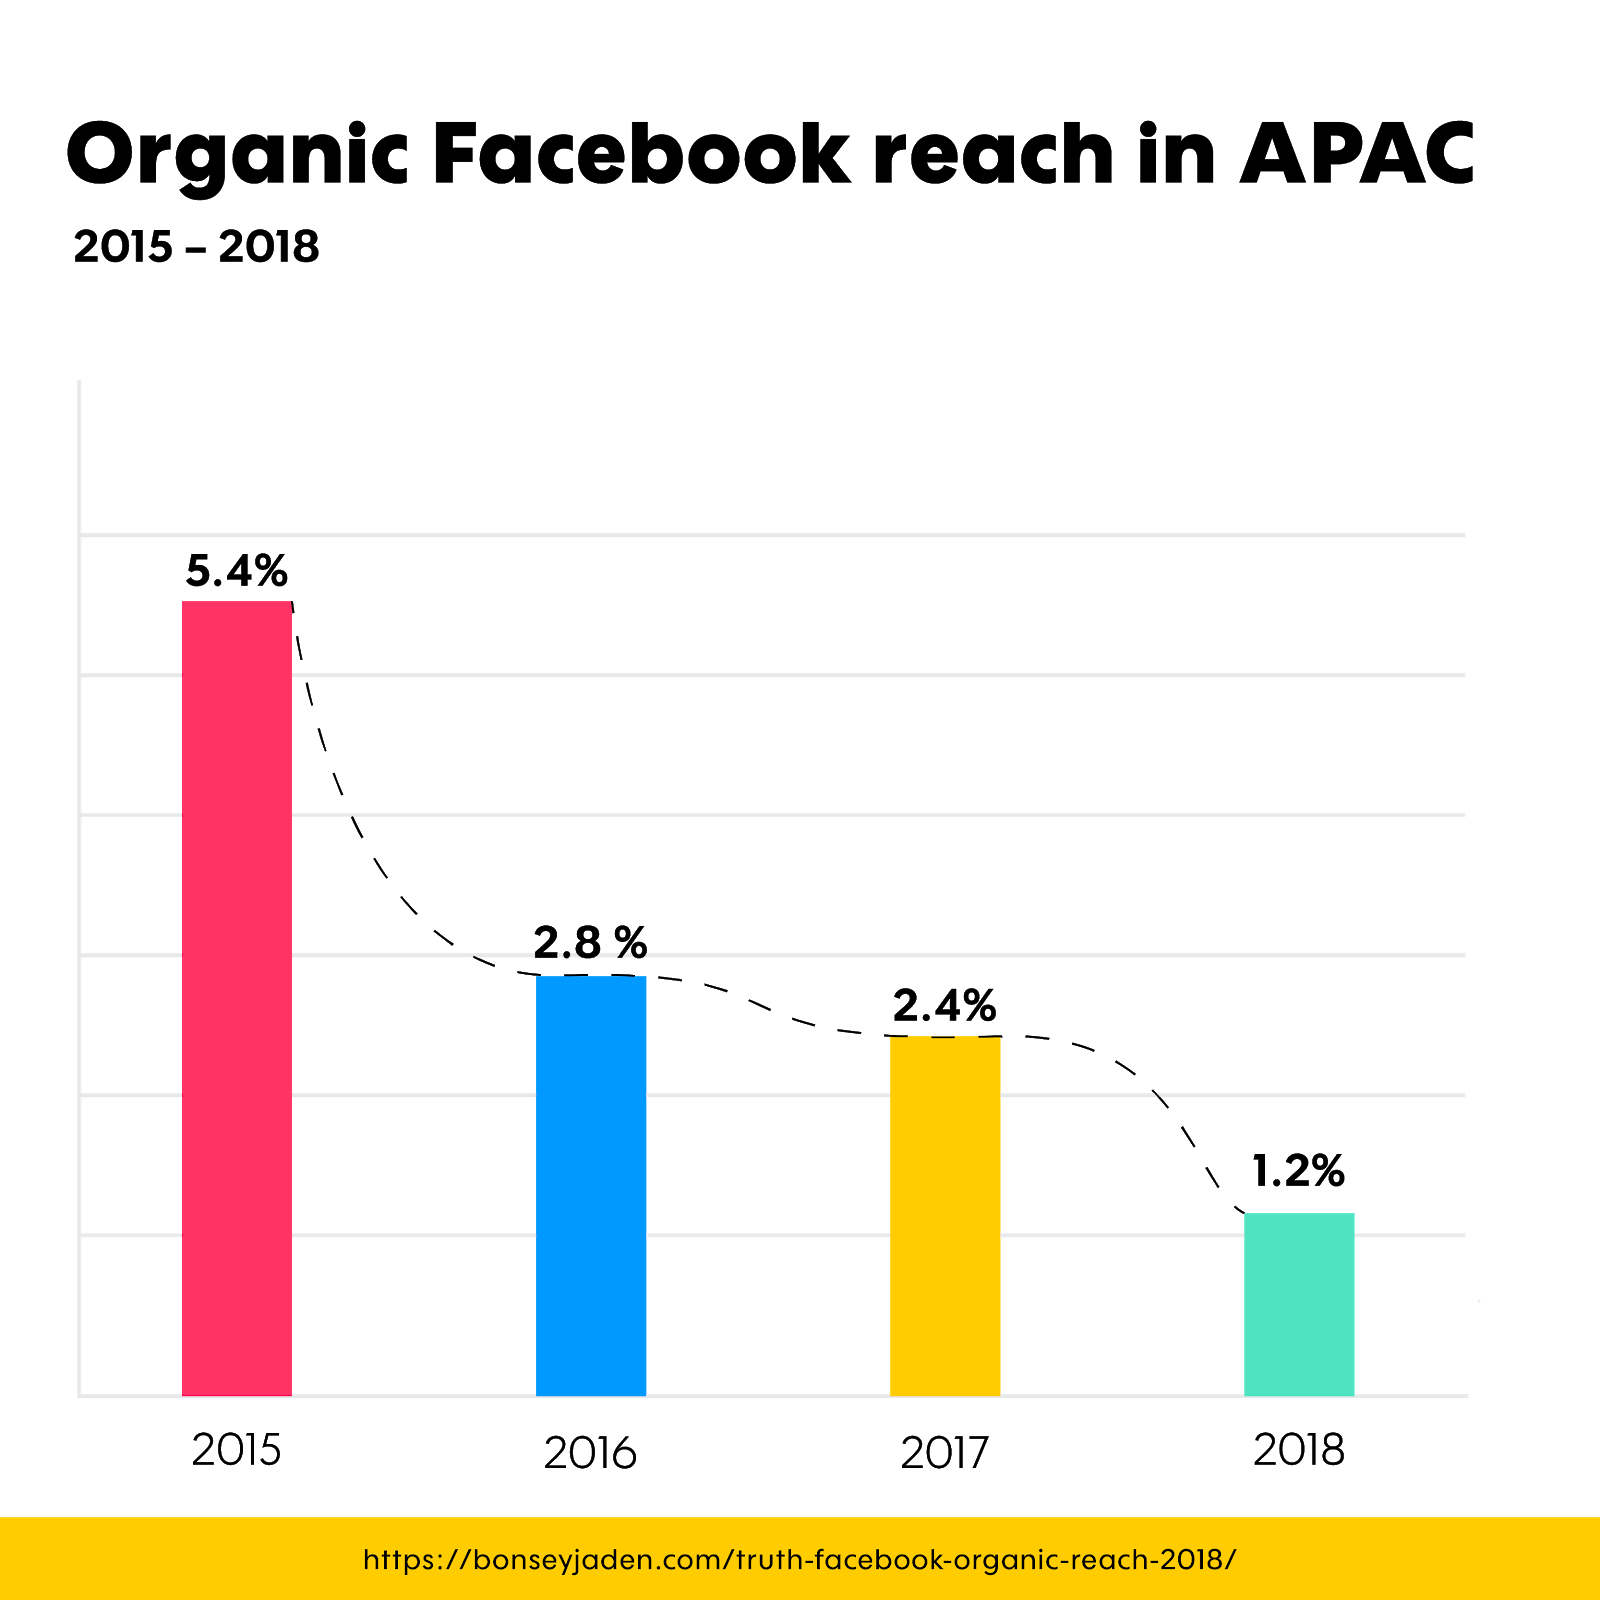
On average, most Facebook posts are only seen by about 1% of the total audience without boosting or promoting the content.
This can give you a general benchmark for measuring your own performance. If you have 10,000 fans on Facebook, then you would expect the reach of each post to be about 100 people (organically).
Social media engagement benchmarking
Looking at social media engagement across different brands is a lot more insightful in terms of how well your content is performing.
That’s because, no matter how many people you ultimately reach, the rate of engagement (as a percentage) can be measured consistently across all of your content and on every channel.
Luckily, there is a lot of great data on the average engagement rates seen by different industries and on different channels.
Here’s what we’re seeing.
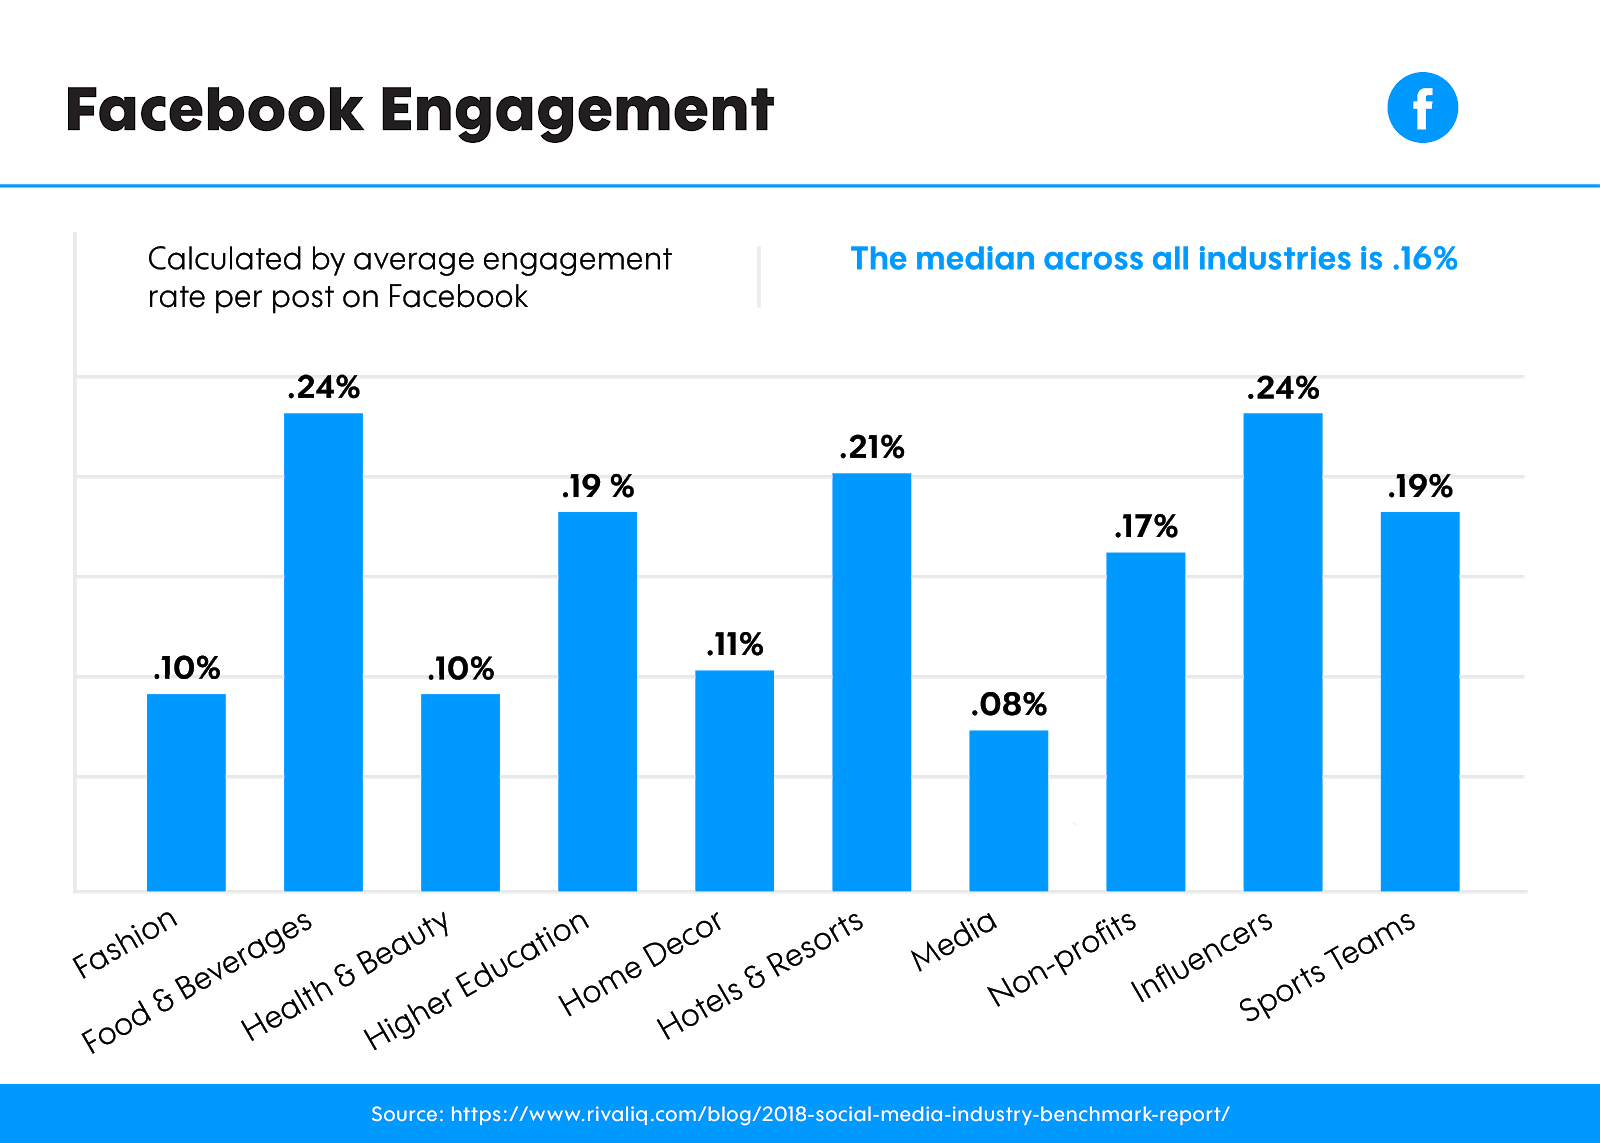
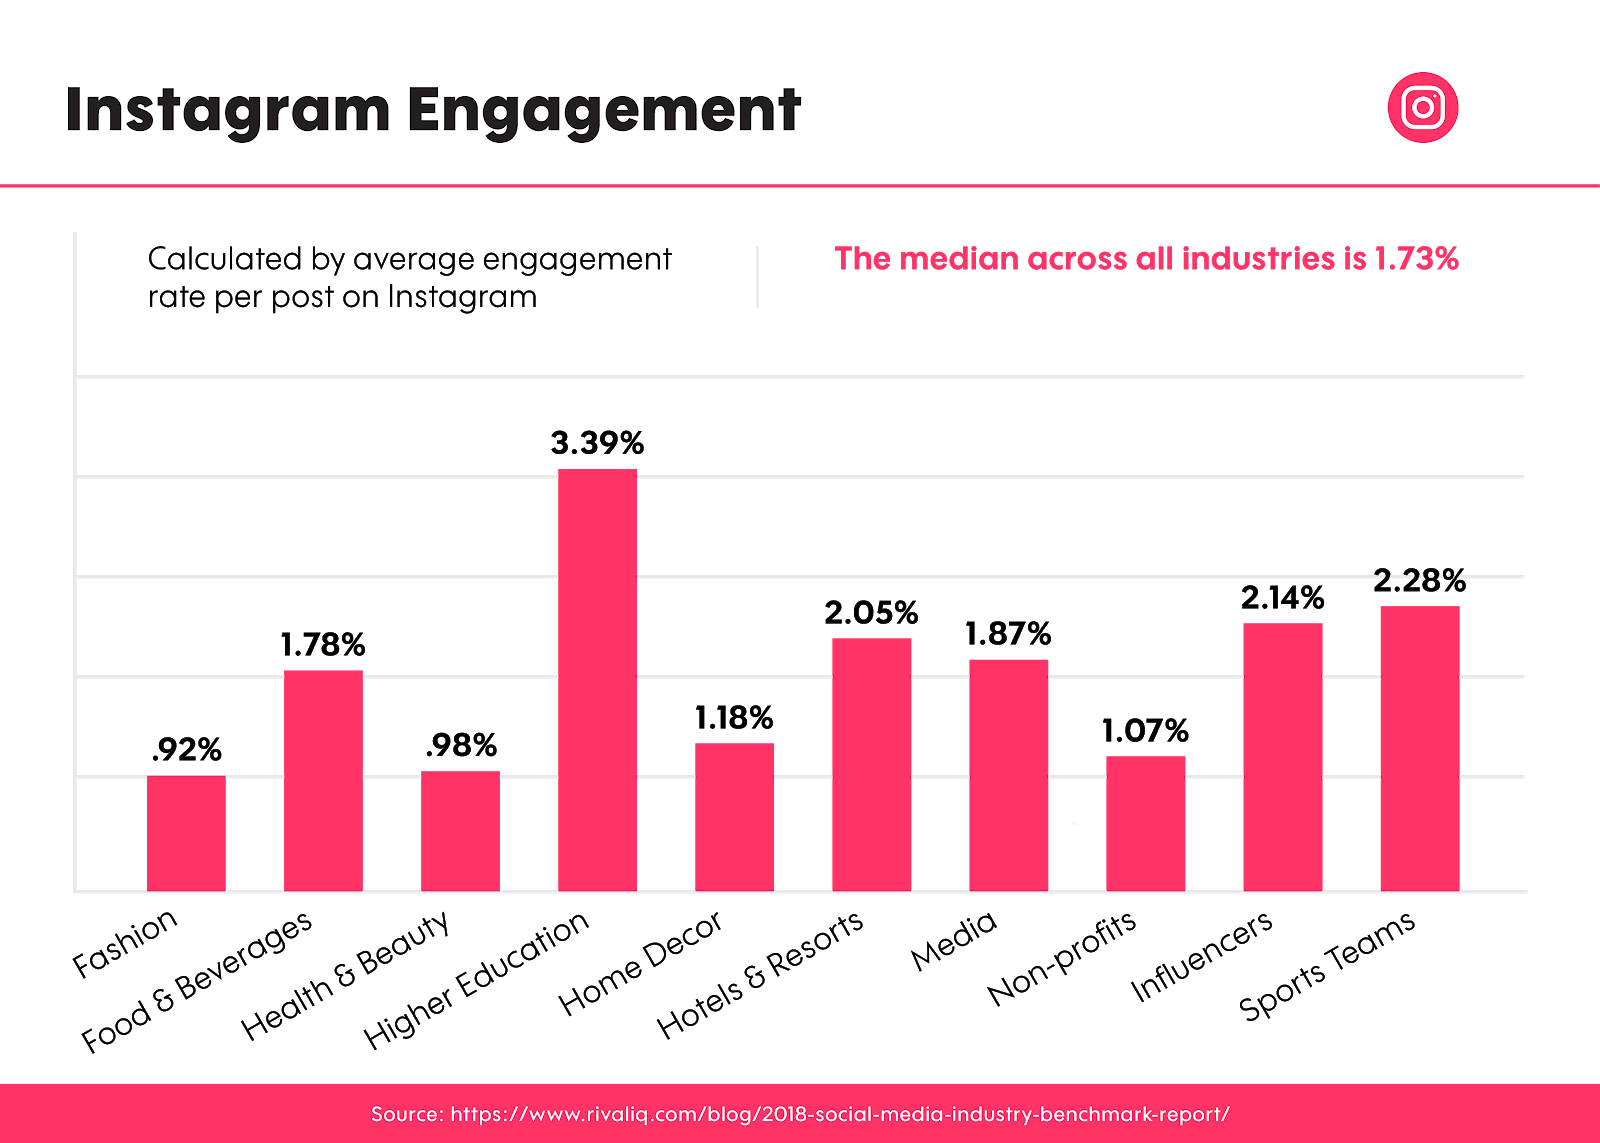
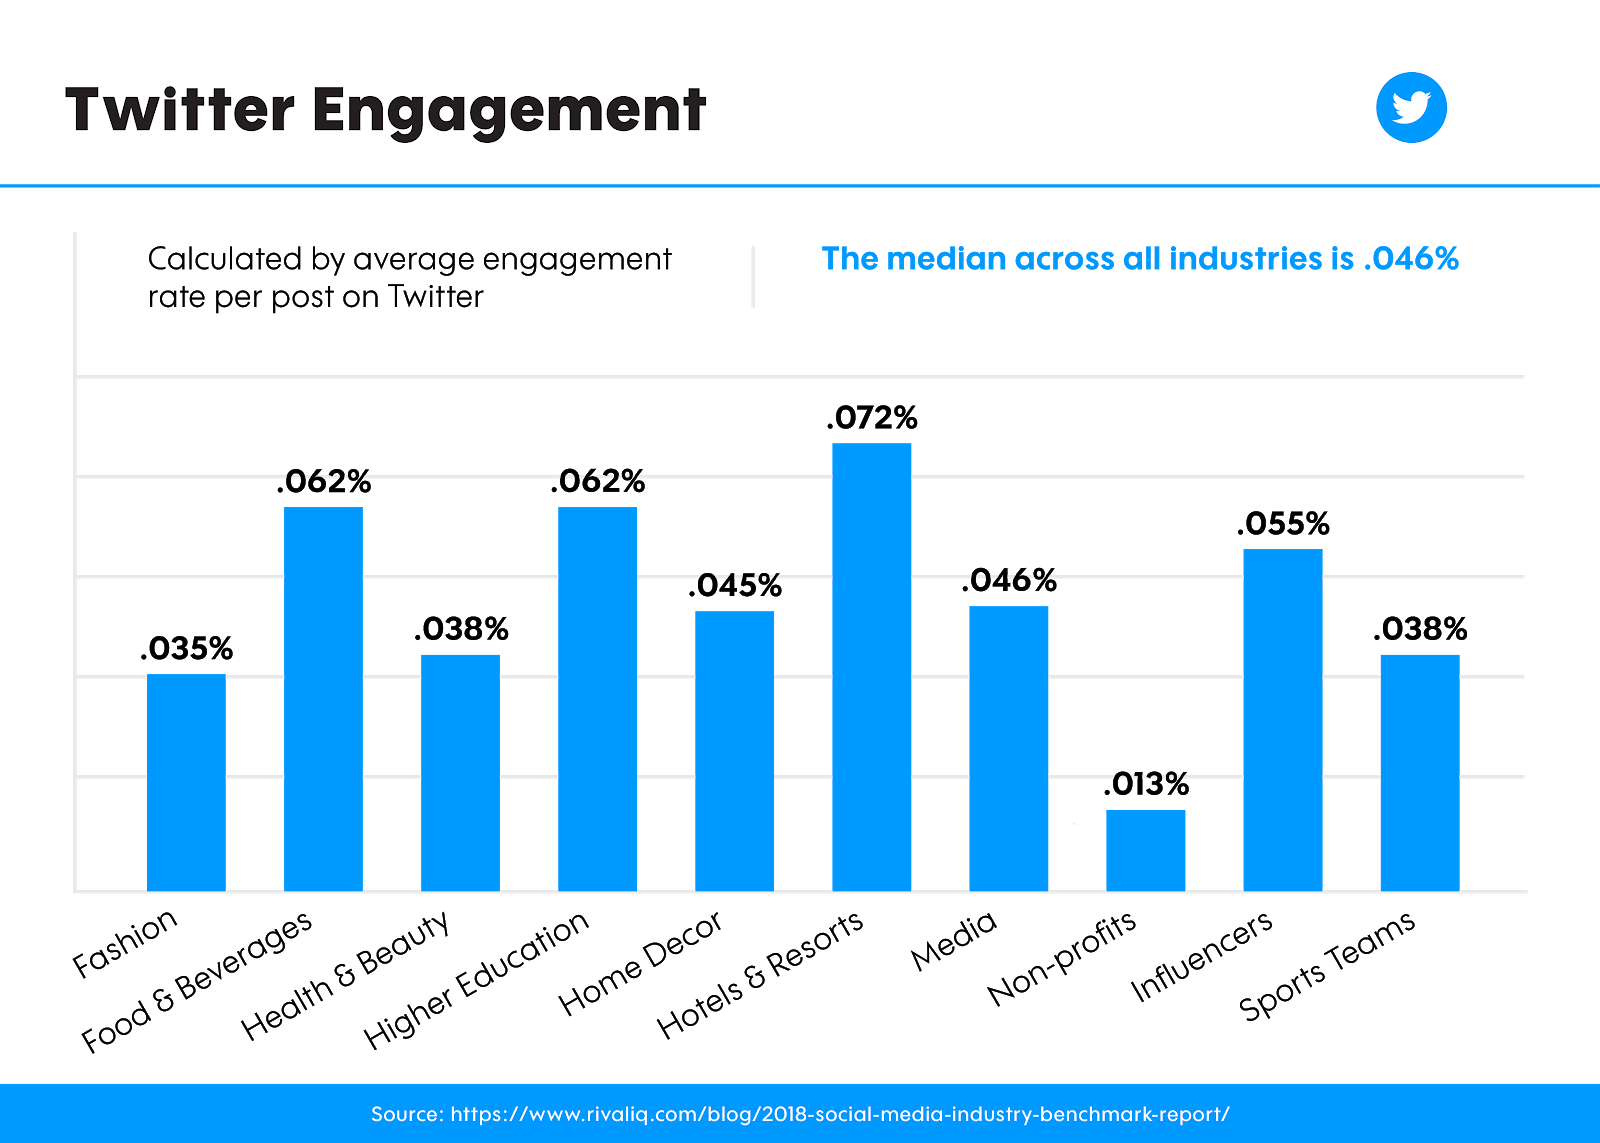
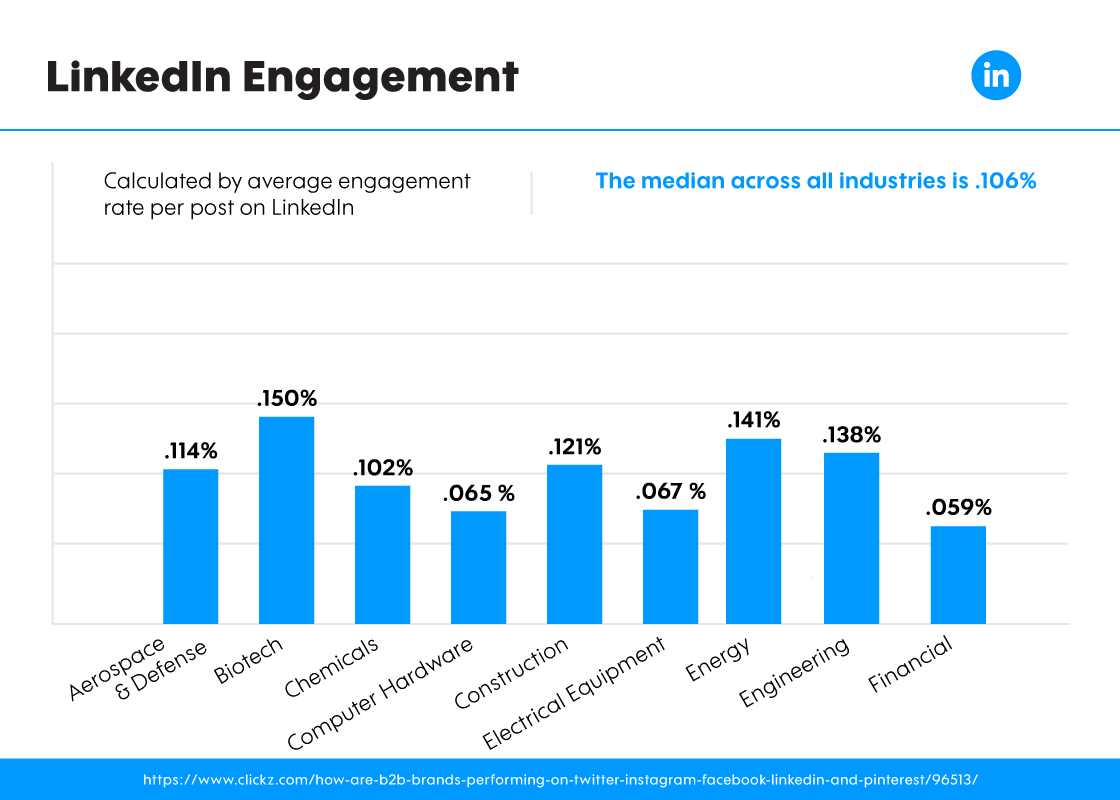
As you can see, engagement on Instagram leads the way across the board. Facebook posts get the second highest level of engagement, followed by Tweets.
Average engagement rates range from 0.013% to 3.39%.
This engagement is calculated as the average number of engagements that happen on each post divided by the audience.
Using this data, set some goals for the level of engagement that you want and expect based on your audience and reach.
Social media conversion benchmarks
Last, but certainly not least, let’s look at the average conversions from most popular social channels.
There’s not much data out there on the overall conversion rate from all types of posts. But, if you’re investing in advertising, then chances are that you’re acutely interested in the conversion rate and whether you’re getting a good return on your spend.
Here’s what advertisers are seeing across various advertising channels:
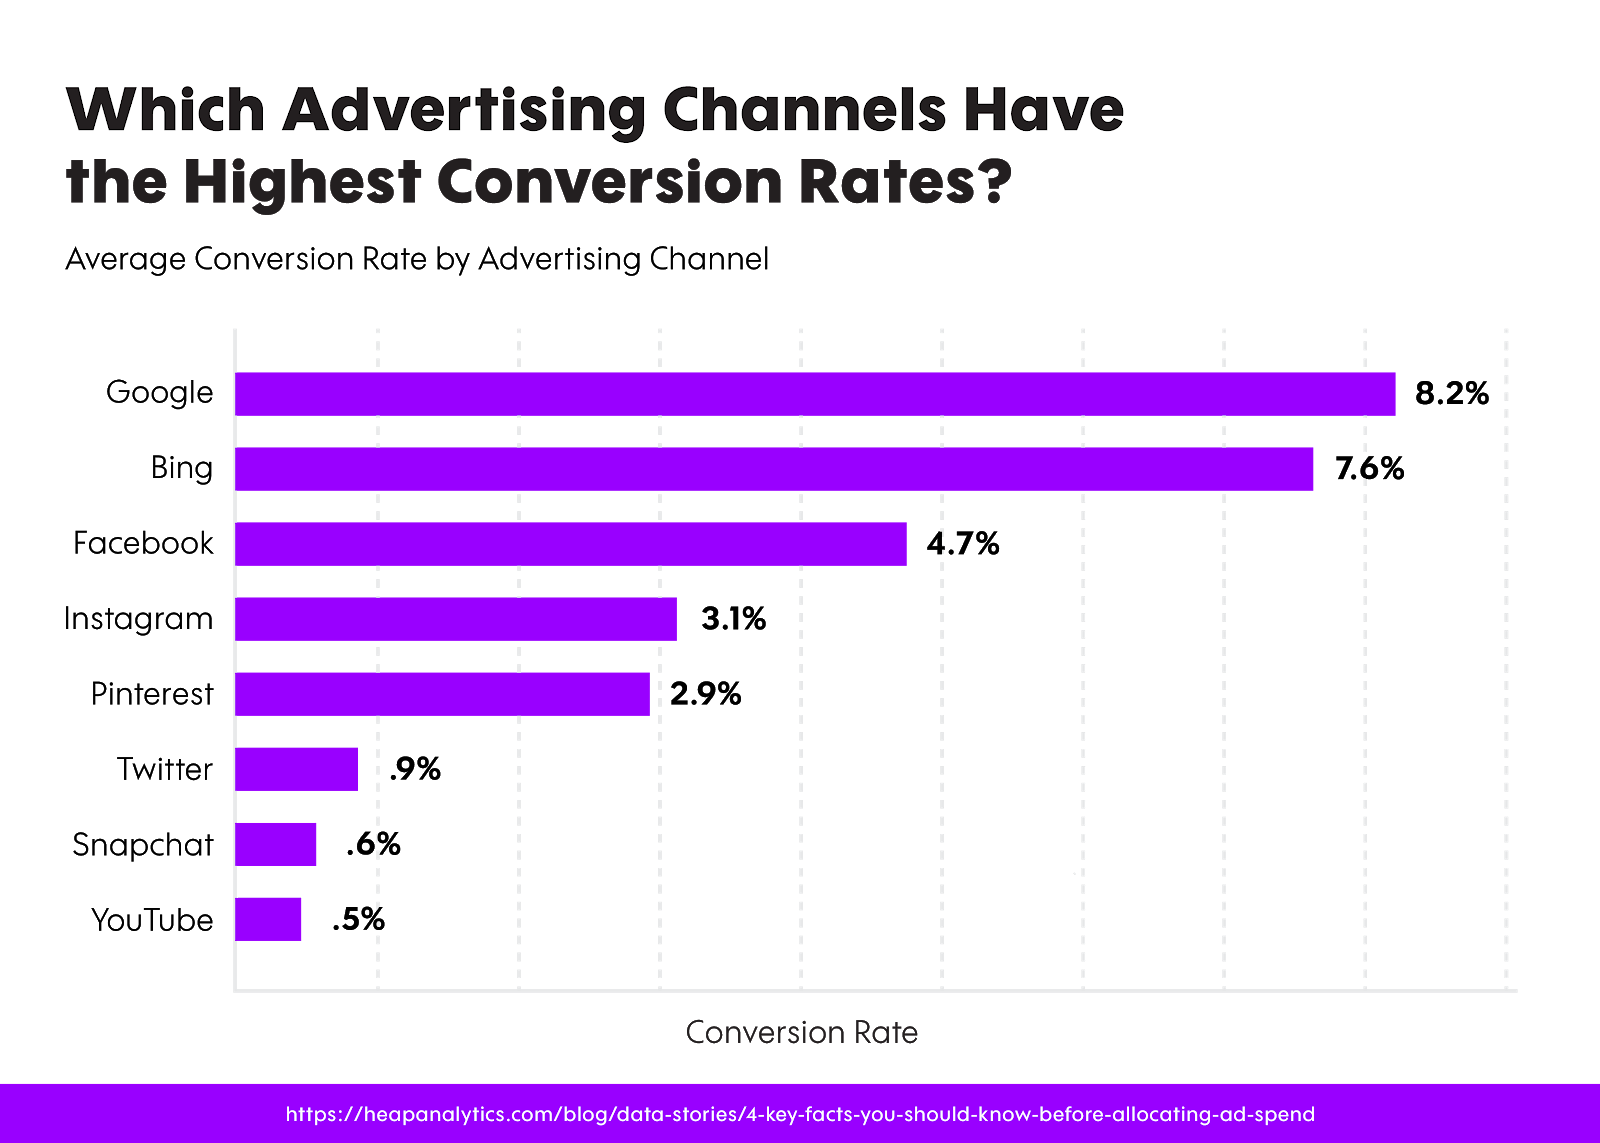
Of course, be sure to consider this data in context.
If you’re selling a $200,000 luxury automobile, your conversion rate from Facebook posts is likely to be much lower than a company selling $20 t-shirts.
Nevertheless, use these benchmarks to provide context to your own performance.
Then, based on where you’re at, set a goal to show continuous improvement over time.
Measuring paid social media efforts
It’s no secret that organic social media reach is dying.
More and more, social media marketing success is dependent on paid marketing efforts. Boosting posts on Facebook, targeting advertising, and more are critical to increasing reach and targeting the right audience.
This also means that you’ll need to measure those efforts very closely.
Now, it’s not a great idea to mix paid and organic social media statistics. But you can create a separate scorecard for your paid efforts to keep track of what you’re spending and what you’re getting from those efforts.
Using the same scorecard template from above, we can calculate the same statistics on reach, engagement, and conversions:
But, when tracking paid efforts, we also want to include the amount spent and then break down the data to include CPM, CPC, and other cost-specific metrics that help us benchmark performance over time.
Similarly, you can track and measure paid performance on a per-post basis, giving you a clear picture of which posts or updates are generating the most bang for
your buck.
Start building your own scorecard
Now that you know what goes into creating an awesome social media scorecard, it’s time to build your own.
The exact metrics and KPIs that you measure might be unique to your company and your goals. But the high-level categories should remain fairly consistent.
You can grab a copy of our social media marketing scorecard template–completely free!
Download: Social Media Scorecard Template
With the right tools and a little effort, you can create the perfect scorecard for measuring your social media marketing efforts.


